
All Toronto stats you need from Hausworth.com
In our recent blog article, we looked at the impact that year 2020 with its closures, lockdowns, and financial challenges had on the safety of Toronto neighbourhoods and its residents, and how safety impacting property has been evolving so far in 2021.
This time, we are going to focus on car ownership and driving in the city and discover which neighbourhoods are the safest for car owners, and where the risk of driving in the City of Toronto is the highest – and lowest – based on our analysis of the number of collisions causing significant damage, injuries, and fatalities.
Long gone are the days when Toronto streets looked like on this photo.
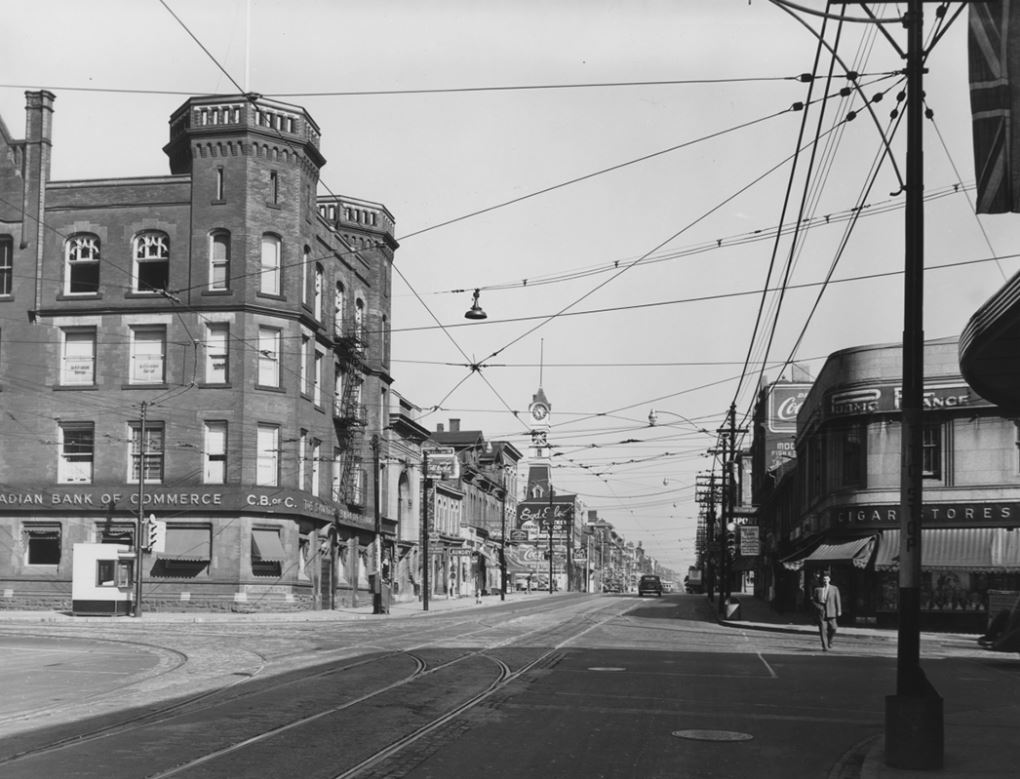
Heavy traffic, congestion, and of course accidents, have become an integral part of driving in the city. We are going to help you understand how the risks of getting into an accident while driving in Toronto vary from location to location.
First of all, a word about the data used in the analysis. 2020 was a very unique year, especially for the residents of metropolitan areas around the world, including Toronto and the entire Greater Toronto Area. To avoid any anomalies in our analysis, we included publicly available collision data for the last 5 years (from the beginning of 2016 through the end of 2020). This way we are able to derive consistent patterns, rather than see a spike or drop due to impact of the pandemic.
To add to the collision data, we will show the risk of theft of your vehicle in different parts of the city. We mentioned previously that overall safety in most of Toronto improved in 2020 as compared to 2019, and only a very small number of Toronto neighbourhoods saw a negative trend in their safety numbers. This applies to the auto theft numbers as well.
First off, looking at the risks associated with driving in the city, here are the top 10 Toronto neighbourhoods with the overall highest number of traffic accidents resulting in collisions over the last 5 years:
- Waterfront Communities-The Island (avg 3125 per year)
- Wexford/Maryvale (2104/yr)
- West Humber-Clairville (2069/yr)
- Woburn (1893/yr)
- Islington-City Centre West (1880/yr)
- Bay Street Corridor (1857/yr)
- York University Heights (1789/yr)
- Banbury-Don Mills (1571/yr)
- Milliken (1494/yr)
- Bendale (1324/yr)
Not surprisingly, downtown neighbourhoods of Waterfront and Bay Street Corridor with their busy traffic feature on the list, but there are also some less obvious entrants, such as Scarborough areas of Woburn and Bendale. As you can see, the Waterfront neighbourhood registers approximately 8.5 collisions daily.
On the other hand, here are the 10 Toronto neighbourhoods that are safest for driving (based on the lowest number of reported collisions):
- Lambton Baby Point (47/yr)
- Woodbine-Lumsden (76/yr)
- Blake-Jones (98/yr)
- Guildwood (120/yr)
- Markland Wood (132/yr)
- Humewood-Cedarvale (145/yr)
- Caledonia-Fairbank (167/yr)
- Edenbridge-Humber Valley (171/yr)
- Princess-Rosethorn (171/yr)
- Etobicoke West Mall (172/yr)
As you can see, there is an order of magnitude difference in the numbers of collisions between the most and the least safe neighbourhoods to drive in.
It’s worth noting that not all collisions are of the same severity. Approximately 1 in 10 collisions reported in the city over the last 5 years resulted in an injury or death. The following Toronto neighbourhoods have the highest recorded numbers of traffic accident-related injuries and fatalities:
- Waterfront Communities-The Island
- West Humber-Clairville
- Woburn
- Wexford/Maryvale
- Milliken
- Islington-City Centre West
- York University Heights
- Rouge
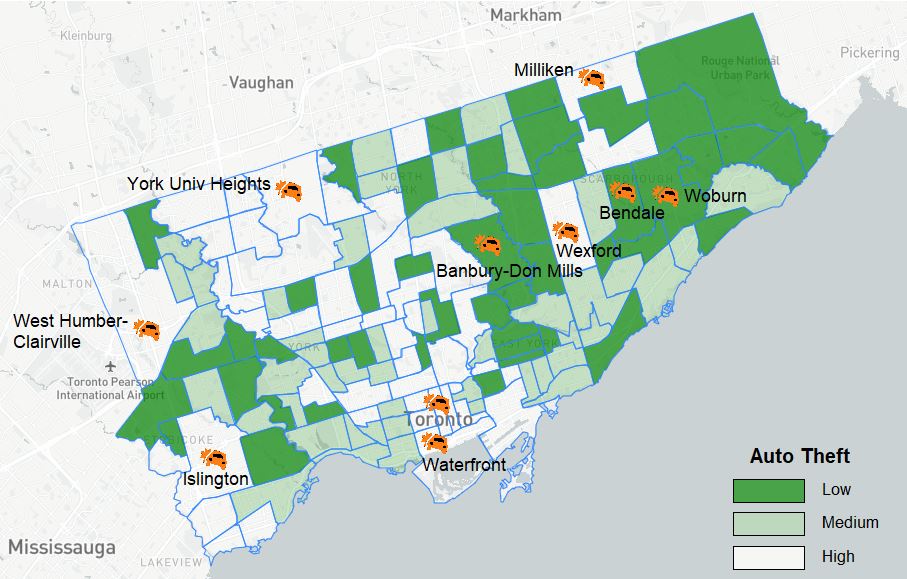
Finally, let’s look at the neighbourhoods based on the risk of having a car stolen. To determine that, we adjusted auto theft numbers reported by the Toronto Police to account for the number of residents in each neighbourhood.
Based on such calculations, the highest levels of auto theft in 2020 per resident were in these Toronto neighbourhoods:
- West Humber-Clairville
- Humber Summit
- York University Heights
- Yorkdale-Glen Park
- Pelmo Park-Humberlea
- Humbermede
- Rexdale-Kipling
- Elms-Old Rexdale
- Thistletown-Beaumond Heights
- Downsview-Roding-CFB
Conversely, the lowest relative numbers of auto theft were reported here:
- Ionview
- Woodbine-Lumsden
- Broadview North
- Flemingdon Park
- Yonge-St.Clair
- Mount Pleasant West
- South Parkdale
- Danforth
- L’Amoreaux
- Centennial Scarborough
You can find more details about each of 140 Toronto neighbourhoods on HausWorth.com, your source of information about the best places to live in Toronto. You will also be able to compare overall neighbourhood standings based on additional criteria, such as schools, immigration, demand for homes etc, as well as see resident profiles for each of the neighbourhoods.


